Aave Price Chart
CoinGecko
Daily price (USD)
50 day average 200 day average Volume
Focus the chart and use the arrow keys to read individual prices.
 BTC$67,141.00▼ 3.04%
 ETH$1,904.68▼ 2.82%
 BNB$614.95▼ 4.05%
 XRP$0.9947▼ 2.59%
 SOL$75.68▼ 6.29%
 TRX$0.3130▲ 0.11%
 HYPE$68.18▼ 8.14%
 ZEC$893.90▼ 8.13%
 XMR$533.74▲ 0.07%
 DOGE$0.0630▼ 3.81%
 LEO$9.30▲ 0.40%
 WBT$65.50▼ 2.58%
 LINK$9.57▼ 4.34%
 ADA$0.1625▼ 5.33%
 XLM$0.1432▼ 3.45%
 NEAR$3.34▼ 5.95%
Fear and Greed13 Extreme fear
ETH gas0.13 gwei

Focus the chart and use the arrow keys to read individual prices.
Aave pools let people supply assets for others to borrow. A borrower puts up collateral and draws an asset from the pool. Interest rates can move with demand for that asset and the amount available to borrow.
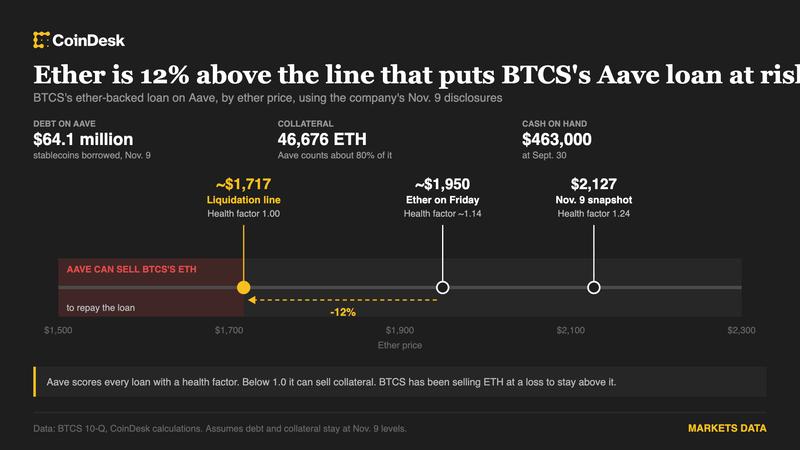
Aave’s health factor compares the value of collateral, after applying the market’s liquidation thresholds, with the value of what is owed. If it falls below one, the position can be liquidated. A change in either the deposited asset or the borrowed asset can push it lower.
AAVE is used in protocol governance. The dollar price above follows that token. For a particular loan, the relevant numbers are the market’s supply or borrow rate and the position’s health factor, all shown in the lending app.